
Project Performance Reporting Best Practice
FROM STATUS UPPDATE TO EXECUTIVE DECISION SUPPORT
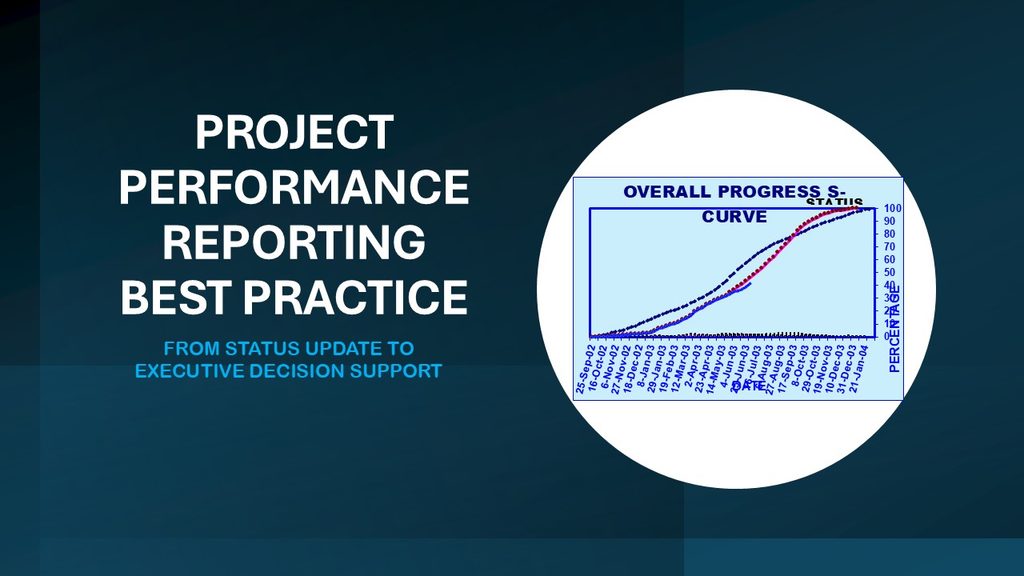
Project performance reporting is most useful when it helps people make decisions, not when it simply restates activity. A high quality report shows whether the project is progressing toward its objectives, where performance is diverging from plan, why that divergence matters, and what should happen next. Best practice therefore treats performance reporting as a management decision support tool rather than an administrative routine. It connects scope, schedule, cost, quality, and risk information into a coherent view of project health and translates that view into action.
Work Breakdown Structure (WBS)
A sound reporting approach begins with the work breakdown structure (WBS). The WBS provides the backbone for organizing performance information because it decomposes the total project scope into manageable deliverables and work packages.
Without that structure, reporting tends to stay too general: the project appears “green” or “amber,” but no one can tell which part of the work is ahead, behind, over budget, or at risk. When reporting is aligned to the WBS, progress can be traced to specific scope elements.
That improves accountability, supports clearer ownership, and allows issues to be isolated rather than buried in project-level averages. It also enables roll-up reporting, where detailed status at work-package level can be consolidated into control accounts, major deliverables, and finally an overall project view.
The WBS also strengthens the reliability of reporting because it creates the basis for planning. Duration estimates, cost estimates, resource assignments, and acceptance criteria are more meaningful when attached to defined work packages rather than broad phases or vague activities.
In practice, this means the quality of performance reporting is heavily influenced by the quality of decomposition done early in the project. If the WBS is unclear, overlapping, or too high level, later measurement will be inconsistent, and variances will be hard to interpret. Best practice is therefore to use the WBS not only as a planning artifact, but as the primary framework for measuring and communicating status.
Progress Measurement
From that foundation, effective reporting depends on progress measurement that is explicit, consistent, and tied to baselines. Progress is not the same as effort expended. Reporting that says a team has spent many hours, held many meetings, or completed many tasks may still fail to show whether meaningful deliverables are actually being produced.
Best practice is to define progress in terms of completion against agreed scope, schedule milestones, and quality expectations. Each reporting cycle should answer a simple question: what planned work has actually been completed to the required standard by the data date?
This requires a clear performance measurement approach. For predictive work, progress may be tracked through milestone achievement, percent complete rules, deliverable acceptance, or earned value techniques. For adaptive work, progress may be reflected through completed backlog items, accepted features, velocity, or burn trends. In both cases, the principle is the same: measure outcomes that reflect real advancement, not activity that only creates the appearance of movement.
Good reporting also distinguishes leading indicators from lagging indicators. Lagging indicators show what has already happened, such as schedule variance or defect counts. Leading indicators signal what may happen next, such as declining stakeholder engagement, increasing rework, or a growing backlog of unresolved issues. The most useful performance reports contain both.
Variance Analysis
Once progress has been measured, variance analysis turns raw data into management insights.
Variance analysis compares actual performance with the approved baseline and determines the size and cause of the difference. This is one of the cardinal best practices in project reporting because status without interpretation has limited value. A report that says a milestone slipped or costs increased is incomplete unless it also explains whether the deviation is minor or material, isolated or recurring, and within tolerance or outside it.
The most effective variance analysis is integrated. It does not examine schedule, cost, scope, quality, and resources in isolation. A favorable cost variance, for example, may appear positive until it is discovered that the project achieved it only by producing less scope than planned.
Similarly, a schedule delay may be tolerable if it protects quality, but unacceptable if it jeopardizes regulatory compliance or a fixed market deadline. Best practice therefore reviews variances in context and against defined thresholds. If a variance breaches tolerance, the report should not stop at description. It should state the likely root cause, the expected impact, and the recommended response, whether that is corrective action, preventive action, replanning, escalation, or formal change control.
Trend Analysis
However, a snapshot variance alone does not tell the whole story. That is why trend analysis is essential. Trend analysis looks across multiple reporting periods to identify direction and rate of change. This matters because one unfavorable period may be an anomaly, while three consecutive unfavorable periods suggest a systemic problem.
Likewise, a project may still be within tolerance today but moving steadily in the wrong direction. If reporting focuses only on current status, warning signs may be missed until recovery becomes difficult or expensive.
Best practice is to show trends visually and analytically. Trend lines for schedule performance, cost efficiency, defect rates, issue aging, or velocity help stakeholders distinguish noise from signal.
Trend analysis should also look at both cumulative and recent period data. Cumulative figures are useful for overall direction, but they can mask sudden deterioration or improvement. Period-by-period trends often reveal whether corrective actions are actually working. In this sense, trend analysis makes reporting forward-looking even before formal forecasting begins.
Forecasting
That forward-looking dimension becomes explicit through forecasting. Forecasting uses current performance and historical trends to estimate likely future outcomes. In high-quality project reporting, forecasting moves the conversation from “Where are we now?” to “Where are we likely to end up if current conditions continue?”
This is critical because management action is usually about the future, not the past. Forecasts of final cost, expected completion date, remaining effort, or likely quality outcomes help sponsors and teams evaluate options before the project reaches a crisis point.
Forecasting is most credible when its assumptions are transparent. A schedule forecast based on persistent low productivity should say so. A cost forecast based on current cost performance index should say whether it assumes present efficiency will continue. Forecasts are not promises, and best practice is to present them as evidence-based projections rather than certainties. Even so, they are indispensable because they support timely decisions about resource changes, scope trade-offs, reserve use, escalation, or baseline revisions.
Ultimately, project performance reporting best practice is about decision support. The report should be structured, evidence-based, and audience-aware. Executives may need high-level exceptions, forecasts, and decision requests, while workstream leaders may need deeper WBS-level detail and corrective action tracking.
In either case, the report should emphasize what changed, what it means, and what action is required. A report full of data but empty of interpretation is weak; a concise report that links WBS-based progress measurement, variance analysis, trend analysis, and forecasting is far more powerful.
In summary, effective project performance reporting starts with a well-constructed WBS, because clear scope structure makes meaningful measurement possible. It then relies on disciplined progress measurement against approved baselines, integrated variance analysis to interpret deviations, trend analysis to reveal patterns over time, and forecasting to anticipate likely outcomes. When these elements work together, reporting becomes more than a status update. It becomes a practical mechanism for control, accountability, and better project decisions.