SCHEDULE FORECASTING MADE SIMPLE
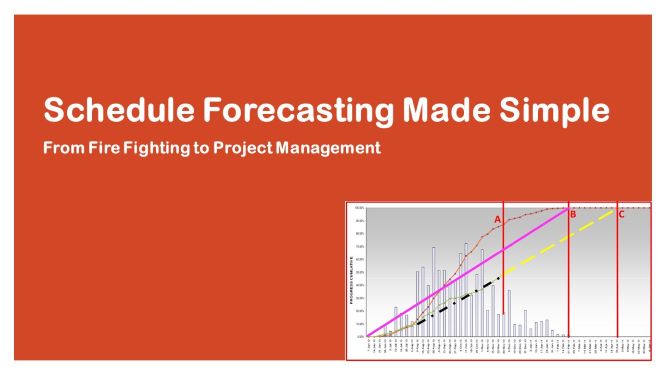
Our topic for today is Schedule Forecasting Made Simple so that you can move from fighting fires to project management. I do not intend to conduct extensive review of forecasting and trend analysis methods. Those are widely available in literature. I intend to present to busy practitioners like myself, a simple, easy-to-use, and reliable forecasting method that they can use.
Project control and project planning personnel are often accused of just reporting historical performance without providing project leaders with the necessary information or data required to make informed strategic decisions to ensure project delivery.
Very often the complaint comes down to lack of trend analysis and forecasting. There have been cases where projects are 10 – 20% behind schedule, and yet project teams continue to give false impressions that the project will be delivered on time without providing objective analytical bases for the undue optimism. And often, they report at the very last minute, when nothing can be done to remedy the situation, that project targets will not be met.
Sometimes, the reason trend analysis and forecasting are not carried out is because of the rigor or complexity of the method or processes specified in project plans or procedures.
Therefore, it is critical that we have a simple and easy-to-use method. Especially, since this will be conducted many times in the life of the project.
This simplified method is the Straight-Line forecasting method. It is a Time Series forecasting method that uses historical values and associated patterns to predict future performance. It is simple, fairly accurate and requires minimum mathematics and effort compared to other methods.
This method assumes what John Chambers et al, in their essay “How to Choose the Right Forecasting Technique”, call ‘A-Future-Like-Past’. That is, existing patterns are expected to continue into the future.
Experience shows that, for most project schedule or completion forecasting purposes, this is adequate. John Chambers and his partners have advised that if the forecaster can readily apply one technique of acceptable accuracy, he or she should not try to “gold plate” by using more advanced techniques that offer potentially greater accuracy but require nonexistent information or information that is costly to obtain. I would also like to add, that is cumbersome to use. The reality is that the more cumbersome the method is the more unlikely that project control teams will use it.
Historical performance data is used to predict the future, typically Milestone Completion Date (MCD) or Project Completion Date (PCD). The fundamental assumption here, as already mentioned above, is that we expect current trends to persist. That is, the project must have a relatively stable historical pattern for the method to deliver reliable results. Therefore, this should not be used too early in the project.
In this simplified method we compute the historical average productivity (HAP) per period (Day, Week, Month, etc.) using historical performance and extrapolate into the future.
Now, here are the steps.
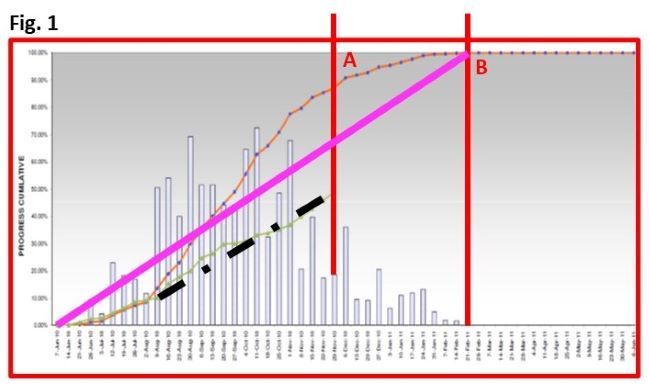
Step 1: Determine average cumulative progress over the period by dividing the cumulative progress by the duration it took to achieve it, up to Data Date (point A). The more stable the pattern of past performance up to this point, the better the prediction of the future.
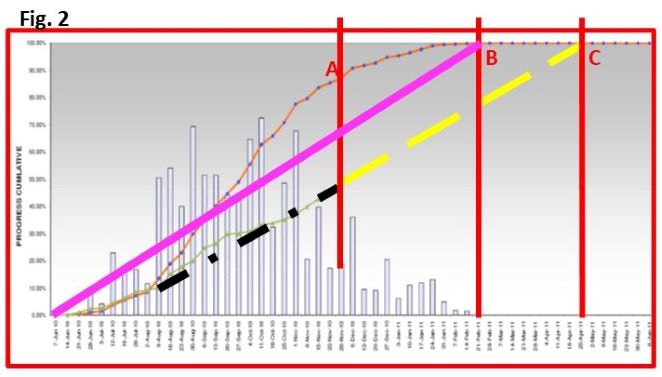
Step 2: Extrapolate or extend or project this into the future by dividing the quantum of remaining works by the historical average productivity. This assumes that the future will be like the past. The bold, yellow, dotted line represents this. After all, the forecast is simply what might happen if current trend persists! This shows a new forecast completion date (MCD or PCD), point C in Fig. 2.
To Summarize:
- Original Planned or Target S-curve is shown in Fig 2, terminating at point B, representing planneproject completion at 100% progress.
- Actual progress is shown in green and is significantly behind plan. The heavy, dotted, black line represents average historical productivity or progress over time.
- The heavy, dashed, yellow line represents the forecast of this trend into the future. It demonstrates that the completion date will end up at point C instead of B, representing about two months delay.
With this, we can say, mathematically:
- It takes so many days to produce 1% progress. Therefore, it will take so many days to complete the remaining works. For instance, if it takes 5 days to achieve 1% progress and remaining works is 30%, then we can safely conclude that it would take 5*30 = 150 days, or 5 months from data date, to complete the project, if current trend persists. However, if unforeseen negative risks materialize then the project may suffer further delay. If there is any expected favorable future event, its impact on project progress should also be highlighted
I will now demonstrate this by an example.
Step 1:
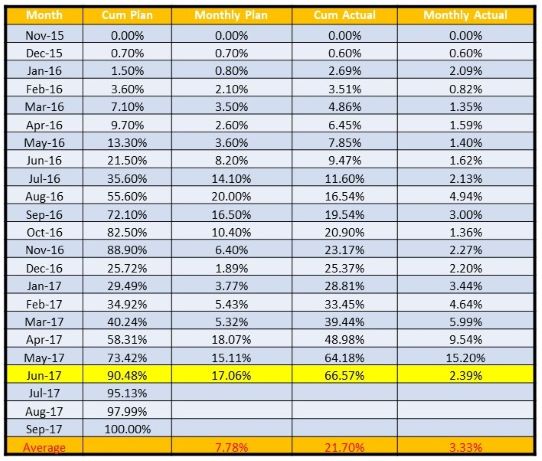
Compute the average cumulative progress for the period – per day, week, or month. This is shown in Progress Statistics (Table 1) below.
Step 2:
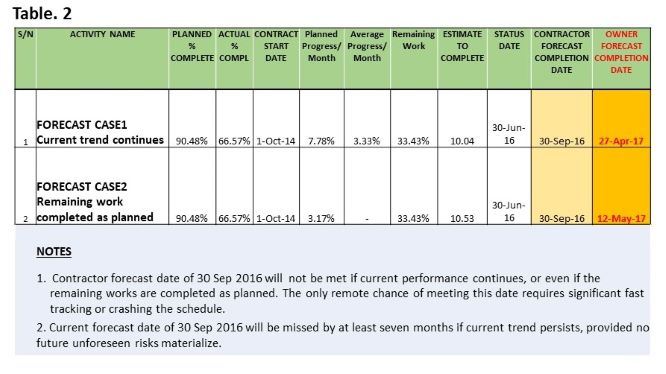
Use this to calculate the forecast completion date as shown in the figure Forecast Completion Dates (Table 2) below.
Step 3:
Draw conclusions to guide the project leadership concerning the basis of your forecast and what to expect. This, to me, is the most useful part of the exercise, and the purpose for forecasting – to advise the team what to expect, and what needs to be done to change things. This is where you bring all the known issues that cannot be modeled, into consideration.
In conclusion, I have shown that schedule forecasting can be simplified by using cumulative average historical data. The more stable the historical pattern, the more reliable the result. Forecasting becomes a simple matter of extrapolation into the future. In my experience, this has yielded satisfactory results repeatedly.
The notes or conclusions you draw are of utmost importance. For instance, if the forecast completion date for a construction project puts the completion date in the rainy or monsoon season, it should be noted because it is likely to cause further delay.
I hope that this helps our teeming population of young and upcoming planning engineers.


